Use Data to Shape Your Nutrient Strategy
As you prep for 2019, it’s easy to remember the one part of the field that did really well last season or the other part that was disappointing. We tend to look at the outliers because they stand out. But this doesn’t show the whole picture or indicate what you should do going forward. That’s why it’s important to use data to provide an unbiased view as well as direction. Here are some ways to use data and technology tools to shape your 2019 nutrient strategy.
1. Pinpoint profit and loss.
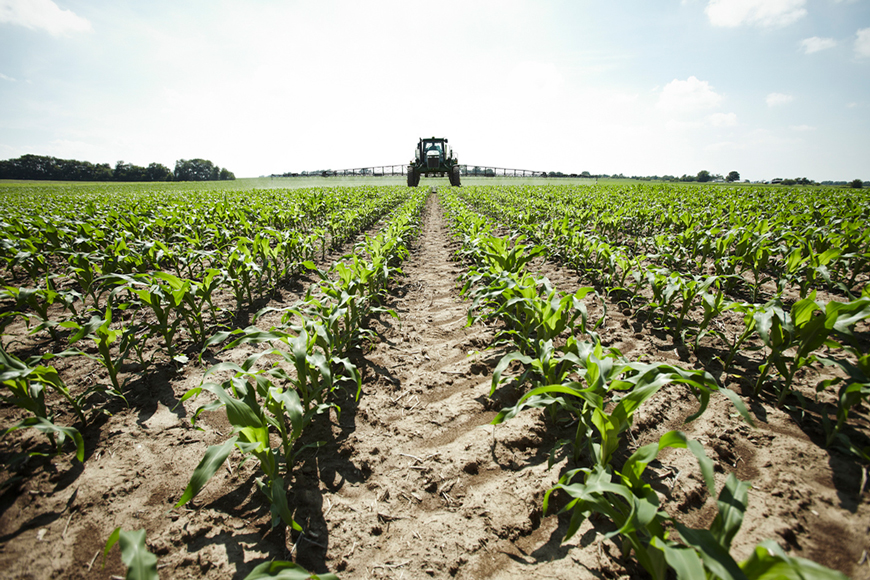
Low commodity prices continue to make it critical to identify which areas of your field are doing well and which need improvement. Areas that were less profitable provide an opportunity to better align your nutrient investment with yield potential in 2019. The R7® Profitability Mapper connects your 2018 input costs, seeding rates and yield map data from the combine to determine the parts of the field that were most profitable. Work with your local trusted advisor to use the Profitability Mapper or another WinField United partner tool that has the ability to analyze end-of-season yield and ROI data.
2. Review all your nutrient information.
Once you know where you’re making and losing money, start looking at soil and tissue sampling results, past yield data, the types of applications you made and the amounts you applied.
3. Be sure nitrogen and sulfur are adequate in corn.
Sulfur levels are directly tied to nitrogen. If you don’t have the correct nitrogen-to-sulfur ratios, you’re not going to get the most out of your nitrogen application. When looking at nitrogen levels, make sure you’re also looking at sulfur, especially since we have seen a higher percentage of sulfur deficiency in recent years. Take another PSNT this season around V5 to determine how much available nitrogen you have in your soil.
4. Leverage in-season tools during the off season.
In-season crop modeling tools, such as the R7® Field Forecasting Tool, can model the outcomes of various operational activities. For example, do you need to do more split nitrogen applications? If so, how and when should you do that going forward? It’s a way to look at different nitrogen practices to see if alternative strategies could pay off. The Field Forecasting Tool incorporates product and operational costs to provide a complete picture to make sure you’re investing wisely to optimize yield and ROI potential.
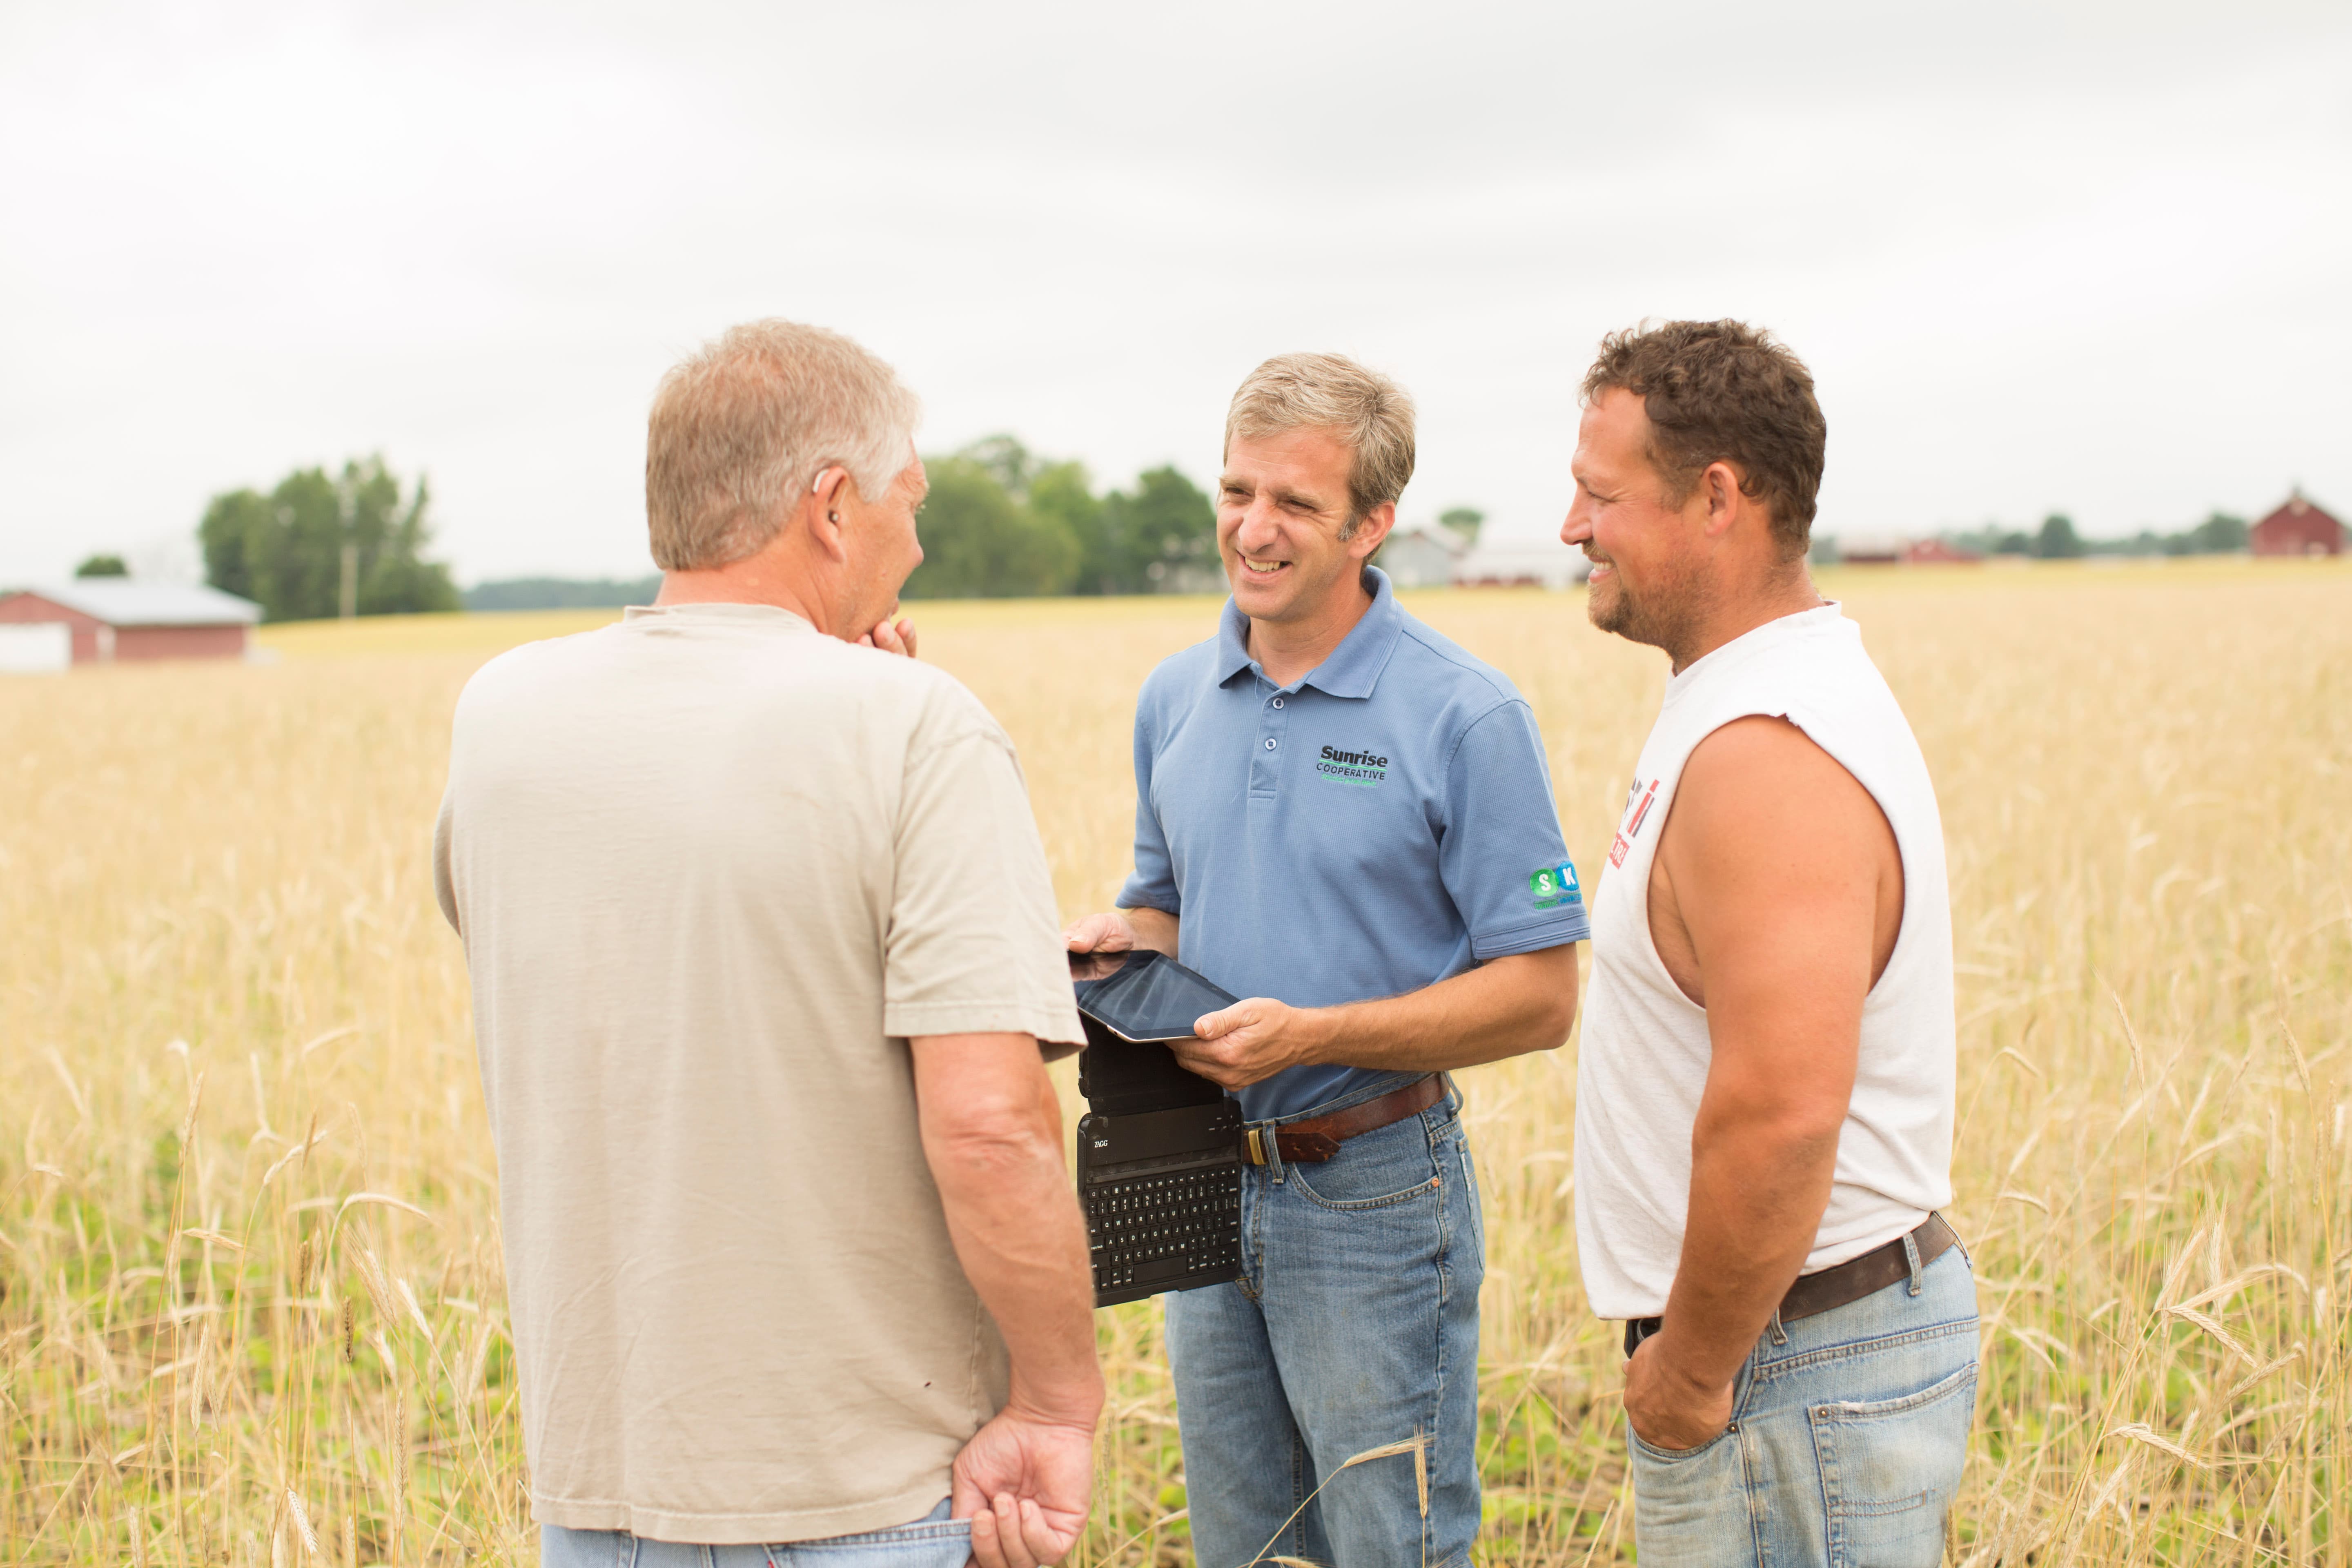
Meet with your advisor now to formulate your nutrient strategy using the technology and data you have at your fingertips.
1. Pinpoint profit and loss.
Low commodity prices continue to make it critical to identify which areas of your field are doing well and which need improvement. Areas that were less profitable provide an opportunity to better align your nutrient investment with yield potential in 2019. The R7® Profitability Mapper connects your 2018 input costs, seeding rates and yield map data from the combine to determine the parts of the field that were most profitable. Work with your local trusted advisor to use the Profitability Mapper or another WinField United partner tool that has the ability to analyze end-of-season yield and ROI data.
2. Review all your nutrient information.
Once you know where you’re making and losing money, start looking at soil and tissue sampling results, past yield data, the types of applications you made and the amounts you applied.
- Along with your advisor, look at the results of soil samples taken last season to determine what nutrients might be lacking in 2019. Correlate this with pre-sidedress nitrate test (PSNT) results you have from 2018 as well as tissue sampling data.
- Tissue samples provide a snapshot of plant nutrient levels throughout the season. From our Answer Plot® data and NutriSolutions® database, we know that zinc, boron and manganese are the nutrients that are often deficient in corn, with potassium and manganese often showing as deficient in soybeans.
- It’s critical to keep accurate “as-applied” files when analyzing a field’s performance. Work with your local retailer to determine best practices for your monitor and for recording data.
- Look at past yield results and note which fields were higher producing. Then, look at your tissue sampling results from those fields. If they indicate nutrient deficiencies, be ready to correct them in 2019 should they occur. In addition, your advisor can supply tissue test results, as well as nutrient trends, from your local area.
3. Be sure nitrogen and sulfur are adequate in corn.
Sulfur levels are directly tied to nitrogen. If you don’t have the correct nitrogen-to-sulfur ratios, you’re not going to get the most out of your nitrogen application. When looking at nitrogen levels, make sure you’re also looking at sulfur, especially since we have seen a higher percentage of sulfur deficiency in recent years. Take another PSNT this season around V5 to determine how much available nitrogen you have in your soil.
4. Leverage in-season tools during the off season.
In-season crop modeling tools, such as the R7® Field Forecasting Tool, can model the outcomes of various operational activities. For example, do you need to do more split nitrogen applications? If so, how and when should you do that going forward? It’s a way to look at different nitrogen practices to see if alternative strategies could pay off. The Field Forecasting Tool incorporates product and operational costs to provide a complete picture to make sure you’re investing wisely to optimize yield and ROI potential.
Meet with your advisor now to formulate your nutrient strategy using the technology and data you have at your fingertips.

Related Articles