Manage IDC With Technology
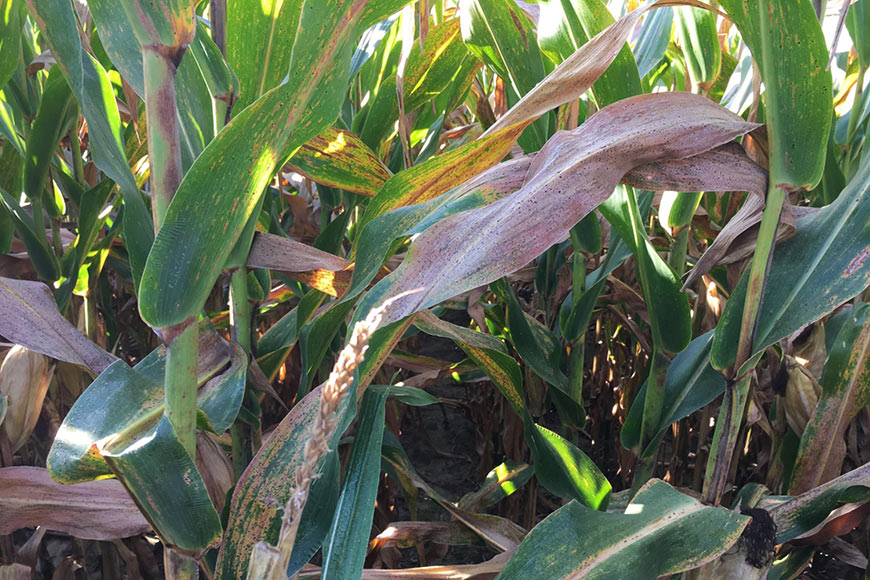
Iron deficiency chlorosis (IDC) is a serious, yield-limiting disease in soybean plants. The most common symptom of IDC is yellowing of newly developed leaves, while veins remain green. Using technology to identify potential problem areas in soybean fields, and employing timely management in areas where IDC is becoming evident, can help protect yield potential.
Using the archive satellite imagery available in the R7® Tool by WinField United provides an excellent way to help manage fields for future IDC issues. In addition, IRONFORCE-H chelated micronutrient has been successfully used to help reduce the symptoms of IDC in soybeans when applied in-furrow at planting. Syncing the two helps give you the best opportunity to increase your ROI potential.
Since the severity of IDC symptoms varies from year to year depending on environmental conditions, it’s best to make the application in the areas of the field where IDC is most likely to develop. Archive imagery allows you to look back to the years where IDC symptoms were historically most severe, compare how consistently those areas have been affected and start to create zones in the field that are most likely to benefit from an application of IRONFORCE-H chelated micronutrient.
Let’s look at an example from a field in southwestern Minnesota, where we used satellite imagery to help identify and treat IDC. Disease severity is indicated by the variability scale to the right of the images below.
This Yield Potential Map from July 5, 2013, shows a normalized difference vegetation index (NDVI) ranging from 52 to 142, which would match up well with the IDC severity that season. This means that there was tremendous variability between soybean plants in this field, from those severely affected by IDC (52) to areas of lush soybean growth (142).
Adding mapped soil test results into the R7® Tool for soil pH and salt levels provides you with two additional metrics to help identify areas where IDC could be a problem. Zones were created here using the mapped soil salt levels, then edited down to two zones of treated versus untreated. The R7® Tool also allows you to overlay other images on the prescription to further edit your application map. This Yield Potential Map from July 5, 2013, was overlaid, allowing for more fine-tuning of the application zones.
Using this prescription for a precision in-furrow application of IRONFORCE-H in early May resulted in no IDC symptoms in July, with field variability on the July 7, 2017, map coming in at an NDVI of 92 to 102, indicating much less variability and better soybean health — a great improvement over the 2013 Yield Potential Map.
As this example demonstrates, there are actions you can take to manage IDC and protect your soybean yield potential. Leverage technology tools to review historical data, and then use this information to act quickly in-season to help manage the disease and minimize field variability.

Related Articles