What Does Your Farming Report Card Look Like?
Advances in agricultural technology have allowed farmers to identify variability in their fields, and then build agronomic plans to help them turn variance into opportunity. And now, variable-rate farming practices are aimed at dialing up things like seeding population and application rates in areas with high potential, and scaling them back in areas with low potential.
This approach of precise seed and input placement helps farmers be better stewards of the land, and in theory, should help their bottom lines. But, it can be difficult to translate the results into dollars and cents to measure the true impact it has on return on investment (ROI), unless you have the right tools to make the connection between agronomics and economics.
Transforming yield data into insights
That is why WinField developed the R7® Tool Profitability Map function. In short, this tool allows you to use yield data to easily evaluate input performance and field profitability. By spatially correlating input costs with yield map data from your combine, you can determine the parts of your fields that were the most (and least) profitable.
This provides the opportunity for you and your agronomist to discuss how to better align input investment with yield potential on less profitable areas for the following year, ultimately allowing you to manage profitability potential on every acre.
And, if you do not have yield data available, you can use a Yield Potential Map from the R7® Tool to evaluate results from the growing season.
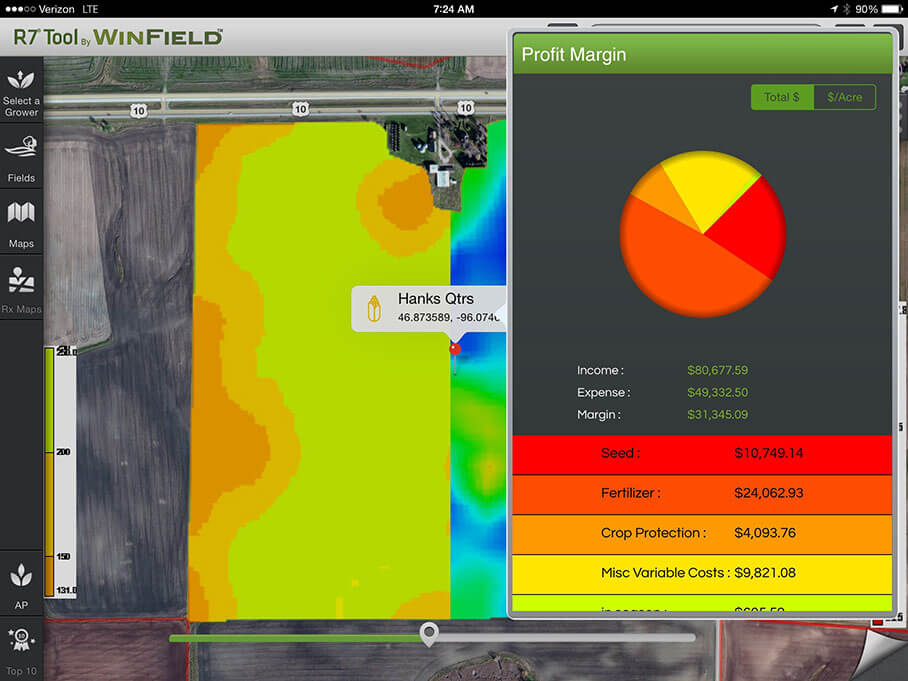
Determining profit margin
The Profitability Map generates easy-to-read maps and charts that illustrate your profit margin at the push of a button. Each budget line item — such as allocations for seed and fertilizer — is taken into account, as well as bushels per acre, to compute gross margin for each field. The result is valuable insights you can use to alter management practices accordingly, season after season, to get the most from your fields.
Sign up for a R7® Tool demo to learn more about the variability in your field and see the top performing seed in your area.
This approach of precise seed and input placement helps farmers be better stewards of the land, and in theory, should help their bottom lines. But, it can be difficult to translate the results into dollars and cents to measure the true impact it has on return on investment (ROI), unless you have the right tools to make the connection between agronomics and economics.
Transforming yield data into insights
That is why WinField developed the R7® Tool Profitability Map function. In short, this tool allows you to use yield data to easily evaluate input performance and field profitability. By spatially correlating input costs with yield map data from your combine, you can determine the parts of your fields that were the most (and least) profitable.
This provides the opportunity for you and your agronomist to discuss how to better align input investment with yield potential on less profitable areas for the following year, ultimately allowing you to manage profitability potential on every acre.
And, if you do not have yield data available, you can use a Yield Potential Map from the R7® Tool to evaluate results from the growing season.
Determining profit margin
The Profitability Map generates easy-to-read maps and charts that illustrate your profit margin at the push of a button. Each budget line item — such as allocations for seed and fertilizer — is taken into account, as well as bushels per acre, to compute gross margin for each field. The result is valuable insights you can use to alter management practices accordingly, season after season, to get the most from your fields.
Sign up for a R7® Tool demo to learn more about the variability in your field and see the top performing seed in your area.