Unlock a Treasure Trove of Year-End Insights
With harvest wrapped up, you are no doubt thinking about how your crops performed, the challenges you faced this season and how you can improve next year’s harvest. Be sure to work with your agronomist to evaluate the past year so you can make informed decisions for the season to come.
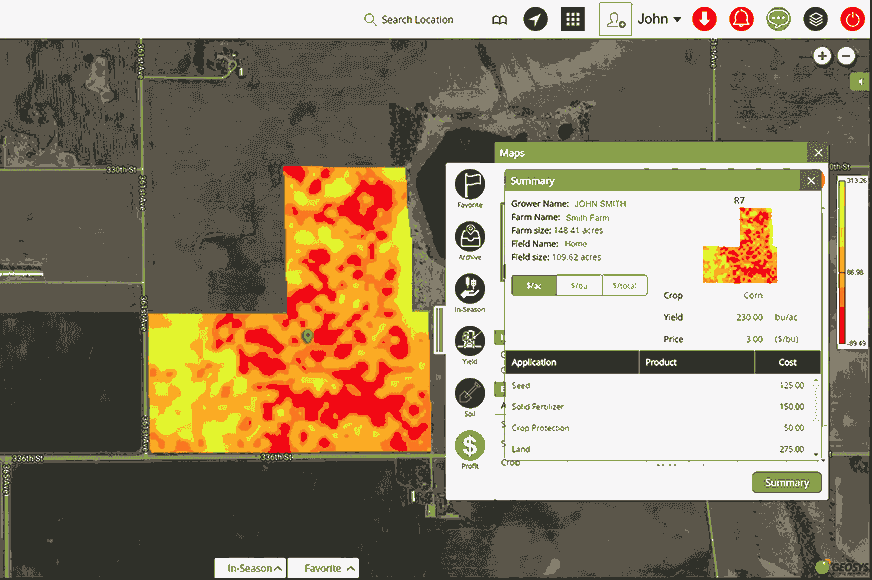
Profitability Map
The R7® Tool Profitability Map helps you manage profitability potential on every acre by connecting input costs, application rates and yield map data from your combine to determine the parts of your fields that were the most profitable. Areas that were less profitable this year offer a great opportunity to talk with your trusted adviser about how to better align input investment with yield potential for 2018.
You can also use the Profitability Map as an indicator of return on investment (ROI) potential by bringing in budgets and costs per acre. In a challenging ag economy, concentrating on optimizing ROI potential rather than optimizing yield is the name of the game. Knowing what areas of your fields have the highest and lowest ROI potential can help you understand what you need to measure so you can manage for next year.
Yield Potential Map
If yield maps are not available, the Yield Potential Map can instead be used with the Profitability Map. A Yield Potential Map offers historical in-season image data to help you understand what spots in the field did well and which areas struggled. Historical data is valuable because it provides insights based on performance from a recent season. In addition, it can be used as the framework to help make decisions for the next crop season, even though each year will be different and filled with new challenges.
Variable-rate Maps
When combined with the Profitability Map, Variable-rate Maps — which are also part of the R7® Tool — help you understand whether the prescriptions you created for seed or fertilizer made a difference. If you haven’t been applying variable rates, this can often be the first fix. Using Variable-rate Maps with the Profitability Map provides a quick snapshot to help you understand how variability affected your bottom line. They also allow you to pinpoint where you can put the brakes on spending or speed it up.
This could mean cutting down on nitrogen, seed populations or another type of input on a poor-producing area. It could also mean pushing yield on your best spots to extract even more ROI potential. For example, if you’re using an average plant population for your area to achieve a particular yield in your highest- yielding spots, and you have a high response-to-population corn hybrid going in that spot next year, the Profitability Map could provide an insight to tell you to push populations higher in those spots.
Talk with your agronomist about how you can leverage the technology available to you to optimize ROI potential. Using the R7® Tool, he or she can access soil maps, soil samples, grid sample maps, tissue samples and historical yield data to help you create your operation’s success story for 2018 and beyond.