Synchronize In-Season Insights
Wouldn’t it be great if all the fields in a farming operation were perfectly flat and had the same rich, dark soil?
That was a nice thought. But now back to the real world, where most farmers need to keep track of all their fields and the variability within them so they can place the right inputs in the right spots at the right times. Fortunately, there (really) is something that can facilitate this.
The R7® Field Monitoring Tool from WinField United is a new technology option that helps you scout more efficiently and plan input applications more precisely by providing up-to-date crop information throughout the season. This comprehensive, timely data can help you save time during the busy growing season by having the intel you and your agronomist need delivered to your tablets to monitor crop progress and promptly address field issues.
The Field Monitoring Tool is fully integrated into the WinField® United R7® Tool, which allows users to quickly access agronomic information as they move from field to field. Here are the primary features and benefits of the R7® Field Monitoring Tool.
1. A multifield dashboard to help you plan your day and help increase productivity.
2. Fresh crop insights daily to identify opportunities to protect and improve yield as the season progresses.
Talk with your agronomist about how the R7® Tool and the Field Monitoring Tool can work together on your farm to provide you with both eye-level and sky-level information to help aid your in-season decision making.
That was a nice thought. But now back to the real world, where most farmers need to keep track of all their fields and the variability within them so they can place the right inputs in the right spots at the right times. Fortunately, there (really) is something that can facilitate this.
The R7® Field Monitoring Tool from WinField United is a new technology option that helps you scout more efficiently and plan input applications more precisely by providing up-to-date crop information throughout the season. This comprehensive, timely data can help you save time during the busy growing season by having the intel you and your agronomist need delivered to your tablets to monitor crop progress and promptly address field issues.
The Field Monitoring Tool is fully integrated into the WinField® United R7® Tool, which allows users to quickly access agronomic information as they move from field to field. Here are the primary features and benefits of the R7® Field Monitoring Tool.
1. A multifield dashboard to help you plan your day and help increase productivity.
- Monitors day-to-day performance of all fields or only those in a designated area. This feature helps enable focused scouting efforts to better manage time and resources.
- Sends a daily summary of field performance, making it easy to identify fields that have had changes in crop health and need immediate attention.
- Benchmarks fields and instantly identifies those that are performing above, at and below average so any needed corrective measures can be prioritized.
2. Fresh crop insights daily to identify opportunities to protect and improve yield as the season progresses.
- Targets fields that have status changes and catches development issues before yield is affected.
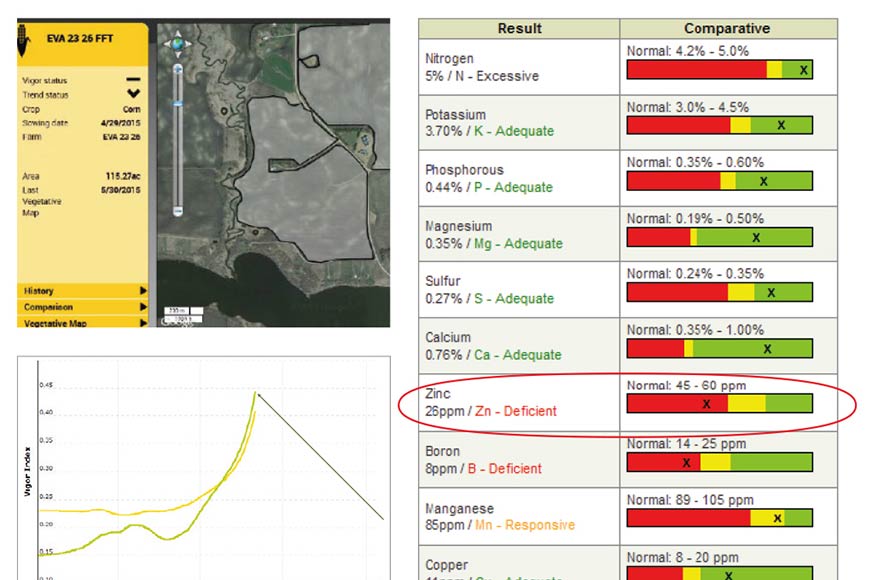
- In-season satellite imagery from the R7® Tool helps with site-specific scouting, tissue sampling or an in-season variable-rate nutrition plan.
- Color-coded field pins indicate crop performance throughout the season to aid in making management decisions.
- After harvest, compares historical normalized difference vegetation index (NDVI) curves relative to the current season to help identify trends in growth patterns and understand crop performance. In addition, the R7® Tool Profitability Map helps determine where money was made or lost in a field and evaluate which in-season inputs provided a positive return.
- Provides current and future field-specific weather information, along with temperature, growing degree days and rainfall graphs.
Talk with your agronomist about how the R7® Tool and the Field Monitoring Tool can work together on your farm to provide you with both eye-level and sky-level information to help aid your in-season decision making.