Tech Provides New Perspective on Alfalfa, Soybean Performance

To help you keep tabs on the health of your alfalfa and soybean crops, combine plant vigor graphs from the R7® Field Monitoring Tool with in-season imagery from the R7 Tool. Here’s a closer look at how to employ these capabilities.
Alfalfa: Know when to rotate stands
In-season imagery can help you determine when to rotate alfalfa fields out of production. As an example, below is an image from the R7 Tool showing an alfalfa field with high, medium and low biomass areas. Each field was divided into zones. In each zone, we documented plant height, stand count and stem count.

The characteristic that showed the most variance between fields and within each field was stem count. We used a value of 55 stems per square foot asa threshold. If you need to scout fields in the early part of the season to determine rotation, identify the low areas indicated by the image and determine stem count and overall stand quality. If a zone has more than 55 stems per square foot, move on to the next field. If there are fewer than 55 stems per square foot, continue to the next zone within that field to evaluate further. This process can help make your scouting more efficient.
You can then pair in-season imagery with trends indicated by the R7 Field Monitoring Toolto know where to focus scouting efforts and any necessary follow-up to help save ROI and yield potential. In the example below, the 2016/17 trend line (purple) indicated a dip in vigor. When scouting this field, which was seeded in 2014, we discovered many areas had zero to three plants per square foot with many patches of dandelions. Plant height was very short, at roughly 8 inches of growth. The decision was made to rotate this field out of production because of poor yield potential and the preponderance of weeds.

Knowing exactly where to go in the field to investigate potential problems is key to having the ability to make informed decisions. This works with other crops as well, such as corn, soybeans and wheat.
Soybeans: Identify late-season disease pressure
It’s important to detect any dip in plant health by tracking biomass — the indicator of healthy, growing plants in the field — so that any necessary action can be taken promptly. We used the R7 Field Monitoring Tool to measure the biomass and plant health of a soybean field and noticed that the index line for the current season (dark blue) began to drop, and drop earlier than in previous years. (It should also be noted that high biomass can also indicate a weed outbreak, so be sure to pair any abnormally high or low biomass reading with boots-on-the-groundscouting.)
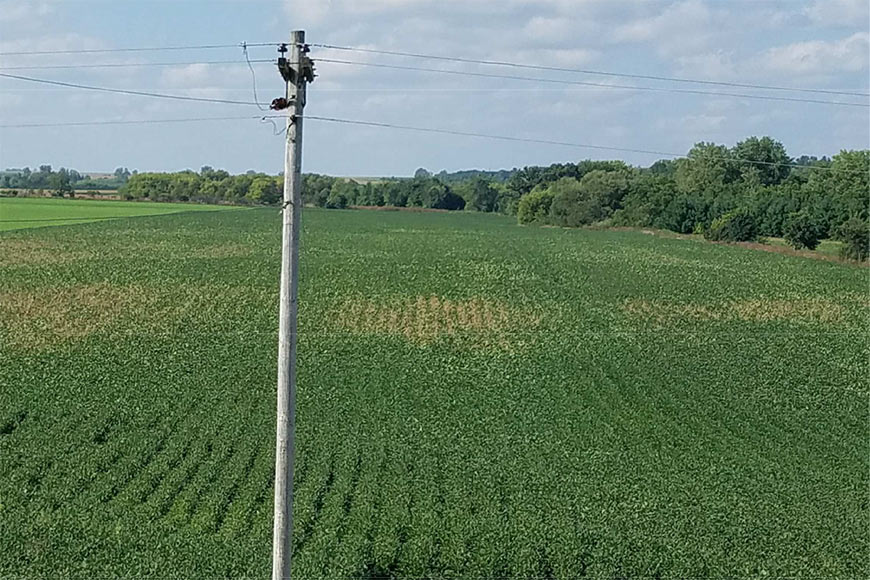
In this case, however, when we scouted the field, we found the beginnings of asubstantial white mold presence. In-season imagery indicated the heaviest pressure in the southwest part of the field (within two weeks, we could tell this with the naked eye as well).

Looking at imagery may indicate other late-season soybean diseases such as sudden death syndrome. Partnering up the two capabilities can help you quantify where disease is occurring in your fields and how much of the field is affected by the time you are able to scout.
To find out more about leveraging in-season imagery and crop vigor status tools to focus on in-field challenges and potential solutions, talk with your local trusted advisor.
© 2019 WinField United. R7® is a trademark of WinField United.


